Blogpost by Julia Lorenz, DPhil student in Medieval & Modern Languages at the University of Oxford. Her research examines the interplay of relationships of love and friendship in Middle High German literature, using a statistical approach and a database to complement her literary analysis.
What happens when we stop reading a narrative text the traditional way – as a sequence of events – and start asking how it is built word by word? The following post uses the courtly romance Engelhard by Konrad von Würzburg as an example to show how digital methods can make hidden patterns visible without replacing close reading. It turns selected scenes from Engelhard into a searchable database that creates additional evidence and offers a new access point to the text.
When we read a literary text, we usually follow the story from beginning to end. We notice figures, conflicts, emotions, and striking images. We interpret scenes as they unfold. This is, of course, essential. But it also has a limitation: some patterns only become visible when we step back from the flow of the story and look at the text from a different angle.
That is what my methodology set out to do.
My thesis studied how relationships of love and friendship are constructed in Middle High German courtly romances: who speaks, who acts, who is described, what kinds of words are used, and how do these patterns change over the course of the narrative. To support this analysis, I created a database of descriptive words from selected scenes of love and friendship in the Middle High German narrative Engelhard. This database did not replace close reading. Instead, it worked like a second lense. It allowed me to see structures that are easy to miss when reading the romance in the usual way.
What Went into the Database?
Engelhard consists of over 6,00 verses, so it was not practical or useful to include the entire romance in the database. Instead, I focused on scenes that are especially relevant to relationships of love and friendship. After selecting the relevant scenes, I extracted all words that had descriptive value. Here, “descriptive value” means words that contribute to how a figure, relationship, action, space, feeling, or situation is presented. Words such as “and” or “the” were not included, because they do not usually add this kind of descriptive information.
This sounds straightforward, but in practice it involved many judgement calls. Whether a word is descriptive depends heavily on context. A word may be meaningful in one passage but not especially meaningful in another. For that reason, I followed a generous rule: when in doubt, I included the word. This meant that the database would rather contain a few borderline cases than risk leaving out words that might later turn out to matter.
Each extracted word became one row in the spreadsheet. In database language, each row is called an “observation”. If the same word appeared several times, it was counted several times, because each use belongs to a specific moment in the text and thus has a its own context and implications. However, it is important to remember that the number of observations is not the same as the total number of words in the romance or even in a scene, because non-descriptive words were excluded.
Adding Context
A list of words alone would not have been very useful. The real value of the database comes from the additional information attached to each word. For every extracted word, I added several descriptive categories, or “variables”. These explain where the word appears and how it functions in context.
Thus, each word was linked to its citation, so that it could be traced back to the exact place in the romance. It was also assigned to a particular scene and relationship. Most importantly, each word was tagged according to what it refers to. Does it describe a figure? An action? Direct speech? Inner thought? The narrator’s voice or a space?
These categories made it possible to compare scenes systematically. Instead of saying, “This passage seems to focus a lot on Engeltrut,” I could check how many descriptive observations refer to Engeltrut, how many refer to Engelhard, and how this changes from one scene to another.
| Word | Citation | Romance/Scene /Relationship | Reference (i.e. object, time, figure, relationship) | Context | Context 2 |
| geselle | Eh, 2347 | Engelhard (Acceptance Eh&Et) | direct speech (Engeltrut) | addressing Engelhard | Engeltrut promises love if Engelhard proves himself as knight |
| bôt | Eh, 559 | Engelhard (Meadow Eh&D) | action (Dietrich) | apple | |
| herze | Eh, 1911 | Engelhard (Rejection Eh&Et) | narrator | love |
I also added freer context notes where needed. These helped preserve the meaning of individual words without requiring constant return to the primary text. For example, a word connected to direct speech could be accompanied by a note explaining what the figure is talking about. This provided a useful tool, as it is easy to lose oversight in a large database. So, the additional context variables were way of keeping the words connected to the scenes they came from.
Reading Through Patterns
Once the spreadsheet was complete, I imported it into the statistics software Stata. This allowed me to filter, count, and visualise the observations. The point was not to turn literature into numbers for its own sake. Rather, the counting helped identify structures that could then be interpreted through close reading.

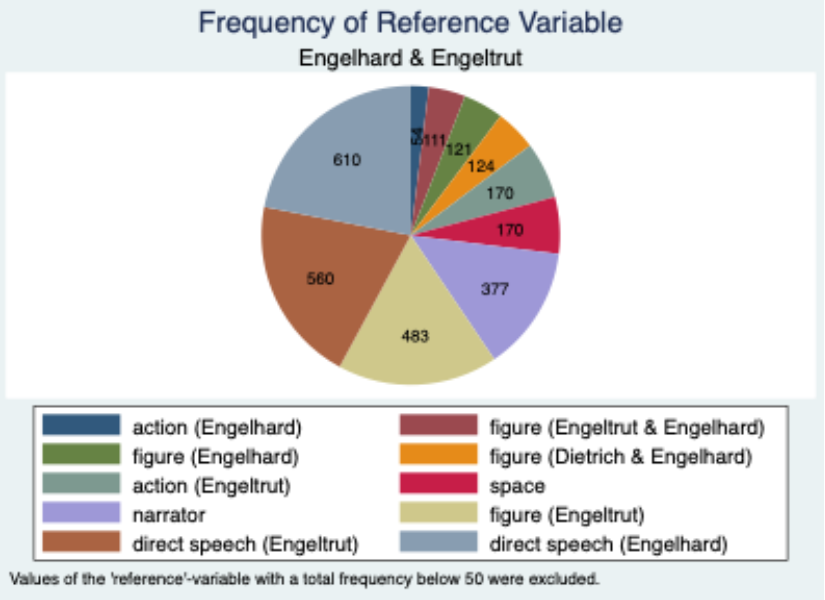
One simple use of the database was to examine how different kinds of description are distributed across a relationship. The example below shows how in the love relationship between Engelhard and Engeltrut direct speech takes up a large share of the observations. More revealing, however, is the uneven distribution of figure-description. Engeltrut is described much more often than Engelhard. This pattern points toward the gendered conventions of medieval love depiction, especially the ritualised description of the female body in representations of courtly love, or minne. The numbers do not prove an interpretation by themselves, but they draw attention to a meaningful imbalance and thus tell us where to look more closely.
The bar chart below illustrates how the database was able to trace developments over time. Here, we can see how the friends Dietrich and Engelhard are characterised throughout the narrative. In the early friendship scenes, the two friends are often described together. Shared description makes them appear identical, as if they were one and the same figure. But after their separation, this shared description nearly disappears. This change reflects what happens in the narrative: the friends are physically separated, and Engelhard’s emerging love for Engeltrut introduces another important relationship into the story.
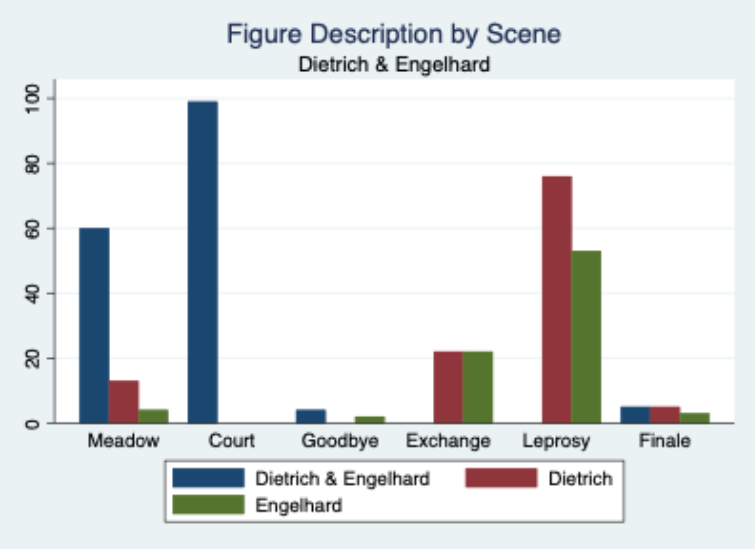
Again, the numbers do not replace interpretation, but they make the development visible in an easily accessible way. They show that the changing relationships are not only evident in the plot but are also built into the wording and structure of the romance: the way the text describes the friends changes as their relationship changes.
This is one of the main advantages of this methodology. It allows us to track narrative development not only through major events, but also through smaller patterns of description, speech, and activity. These patterns can reveal shifts in identity, closeness, and power dynamics.
What the Database Can and Cannot Do
The database was designed as a descriptive tool; it does not interpret the primary text. It cannot tell us what love “means”, or whether a friendship is emotionally equal, socially advantageous, or narratively unstable. Those questions still require literary analysis.
What the database can do is organise evidence. It can show that one figure is described more often than another, that direct speech dominates a scene, that shared description declines over time, or that certain concepts recur across different relationships. These findings provide starting points for interpretation.
It is important to stay mindful of the limitations of this methodology. A statistical analysis of the database can be carried out without detailed contextual knowledge, but its results cannot be interpreted productively without returning to the literary and historical context. The database can show patterns, but it cannot explain their meaning by itself. Its strength lies precisely in this supporting role. It offers a structured, searchable, and expandable way into the text, while close reading remains necessary to understand what the patterns actually mean. The result is not a mechanical reading of literature, but a more layered one: one that moves between words, scenes, relationships, and larger narrative structures.
A Hybrid Approach
At its heart, this methodology is about combining two ways of reading. Close reading allows us to understand nuance, ambiguity, and literary meaning. The database can be searched, sorted, and filtered systematically, allowing us to see patterns. Used together, they make it possible to move between detail and structure: from individual words to larger narrative developments, and back again.
This also means that the database has value beyond the immediate thesis project. Because it is designed to describe rather than interpret the text, the material it contains can be reused, expanded, and approached through new research questions. Building such a database is time-consuming, but once the information has been gathered, it does not have to serve only one argument. A broader network of this kind of database could help researchers work with a wider range of primary texts while still keeping track of themes, structures, and recurring concepts. It could also support collaborative and interdisciplinary research, since the data can be shared, checked, and expanded by different researchers. The ability to create charts and graphs is especially useful here, as they make complex findings easier to communicate, for example in conference presentations or discussions with readers who are less familiar with the text.